Help with Queries
The ELF query system lets you obtain specific labor estimates of the number of workers or the number of full-time equivalent workers (FTE). Queries involving FTE require you to select FTE based on primary job hours, secondary jobs hours, or all job hours. All queries work similarly. First, select the type of labor estimate you wish to calculate. Then, select the specific time period and any location, demographic, nativity, workforce, or industry/occupation characteristics of interest. Finally, click the
 button. Results from your query will be displayed in a table that can be exported to an Excel, Word, or .pdf document. Details on designing queries that will produce your expected results are listed in the “how to” sections below.
How to
- Select query parameters
- Select industry and occupation codes
- Get more than one estimate at a time
- Format the results output
- View all variables available within the system
- Do another query
- Troubleshoot a query
- Use advanced query options for FTE calculations
- Use advanced query options for data weighting
 How to select query parameters
Click on the
 button in any of the query parameter boxes located under “Step 2: Select query parameters” to display available parameters. Select your choice of parameters. Multiple parameters may be selected from lists marked with the symbol
 (hold the Ctrl key down while clicking on individual items or hold the Shift key when clicking on the first and last item of a continuous list). Click the
for examples and detailed instructions.
(hold the Ctrl key down while clicking on individual items or hold the Shift key when clicking on the first and last item of a continuous list). Click the
for examples and detailed instructions.
Note: Except for “year” which defaults to the most current year of data available, all other variables have a default parameter of "ALL." This will produce a national employment estimate that is the grand total for all workers for the selected year(s). Selecting specific parameters will produce an estimate for a narrower worker subset. For example, set SEX = MALE to get the number of male workers or MEMBER OF UNION = YES to get the number of workers who are union members. Selecting SEX = MALE and MEMBER OF UNION = YES will produce the number of male workers who are members of unions.
TIP: To prevent an expanded query parameter box from collapsing when another query parameter box is opened, click on the
 button at the top left of the query parameter box to lock the box. Click on the
 button again to unlock the box and allow it to be collapsed.
TIP: Resting your cursor on a
 symbol in the query system will result in a pop up text box with cautionary information related to parameter selection or results interpretation.
TIP: Click on a variable name for more details about a specific parameter.
TIP: The year range displayed in red beneath many variable names indicates the years during which that particular variable was available. Often, another version of the variable was available for other data years; however, the response options do not correspond between versions. Checking the “Show details” checkbox in the upper left corner of the query screen will display variables available in data years that were not selected or that are only available based on selection of specific query parameters.
Caution: The Bureau of Labor Statistics does not recommend reporting estimates of less than 1,000. Consequently, the more restrictive your query choices, the less likely you will be to obtain reportable results.
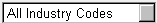
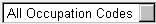
How to select industry and occupation codes
The classification systems for industry and occupation have hierarchical structures with major groups and more specific groups. The breakdown of groups depends on the year(s) of data selected for analysis and whether the Bureau of Census (B.O.C.) codes or an alternate coding scheme were selected. All remaining information in this section applies only to B.O.C. codes.
Individual cases are coded to the maximum detail level possible. For B.O.C. codes this involves 3 digits prior to 1992 and 4 digits for 1992 and beyond. Aggregate categories are the sum of all subcategories and individual codes listed below the aggregate category. The subcategories and individual codes can be viewed by selecting the
 sign. A detailed list of all industries or occupations selected can be seen by clicking the
 button.
To select codes
- Click the
 button to display the code tree. A list of industry or occupation groups will appear in a new window.
 - Click on the plus symbol to expand the tree to see lower branches (i.e., more detailed codes)
- Click on the minus symbol to hide lower branches
- Lower branches are automatically hidden when a new branch is expanded for viewing
To search for a specific code
Enter a word or text string into the Search box to find specific codes within the tree that contain the text in the code description.
- Text matches will appear in a clickable list below the Search box. Click on an item to move to that section of the tree.
- If you are looking for a specific code number, enter the number into the Search box to move quickly to the specific part of the tree.
To select a category or an individual code
- Click on an open box to select a category or an individual code
- Categories that are partially or fully selected will be marked with a hash

- Individual codes that are selected will be marked with an X

To undo selections
- Click on the
 button to undo all selections lower on that particular tree branch
- Click on the
button to undo an individual code selection
To view selected code(s)
- Click on the
button to display the specific code or codes that you have selected for your query.
- To modify your selections, click on the
button to return to the code tree window.
- If you select codes, the status indicator on the main query screen will change from
 or
or
 to
to
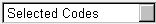 .
.
To return to main query page
- Click the
 button to return to the main query page
Note: The user should have some familiarity with the coding structure prior to reporting the results from this system (see Technical Info).
TIP: Click and remember! The hash mark indicates that some or all codes have been selected along a tree branch. Only one branch within a division is visible at a time. Remember what you select and verify your selections in the results output table.
How to get more than one estimate at a time
Use the “Step 3: Select Report Variables” section pull-down lists to produce a table of estimates for each subcategory within a parameter. Up to three categories may be selected by using Column Variable (1-Major Group), Row Variable (2-Major Group), and Row Variable (3-Sub Group). Depending on the categories selected, the results table will have a column or row for each estimate by subcategory and a final row with the query total. If categories are selected for both Row Variables, a subtotal row will also be given for the first Row Variable items.
Note: The Select Report Variables feature produces tables similar to the common CROSS-TAB output from many statistical programs. If SEX were selected as the first category, the results table would have estimates for males, females, and all workers (grand total). If, in addition, AGE GROUP were selected as the second category, the results table would have estimates for males by age group with a subtotal for males and similar estimates for females. If AGE GROUP were the first option selected and SEX the second option, the estimates would be the same as in the preceding table, but the order of estimates would be rearranged. There is no required order for selecting categories. A Row Variable may be selected with no Column Variable selected. Similarly, either Row Variable can be selected without specifying a category for the other Row Variable.
TIP:The blank, color coded table to the right of the report variable drop down lists shows how results will be displayed, depending on the column and row variables selected.
Caution: When using SELECT REPORT VARIABLES, industry code and occupation code category selections will produce very lengthy tables if a specific industry and/or occupation query parameter is not specified. Due to the extensive list of both of these codes, neither is available for selection as a Column Variable.
How to format the results output
Once the query is submitted and results are displayed you may select one of three options to export the query results. The following options are available under the Query Parameters description box:
- Excel: Results are output in spreadsheet format into Microsoft Excel.
- Word: Results are output in .rtf format into Microsoft Word.
- Adobe Acrobat: Results are output in .pdf format into Adobe Acrobat.
- Show Graph: Selected results are output into a bar chart. In order to graph results, you must check the box to the left of each result you want included on the graph
Note: In the results table, the number and column format is fixed. Download the results file to your computer in Word or Excel to change these formats. Files downloaded as pdfs or displayed as graphs are static and are not modifiable.
How to view all variables available within the system
Checking the box next to “Show details,” located in the upper left corner of the query screen, will display all variables in the query system, including those available in unselected years of data and those that are only available based on selection of specific query parameters. Variables that are not available are displayed in gray text and cannot be queried unless parameters are changed as specified in their individual descriptions, also provided in gray text.
How to do another query
There are three options for navigating back to the query page from the results page:
- Click on the
 button, your most recent query parameters will be preserved when you return to the query page.
 - Click on the
 button. Your previous parameter selections may be retained depending on your browser setup.
 - Use the Back button on your web navigator. Your previous parameter selections may be retained depending on your browser setup.
TIP:To reset query parameters to the default values select the
 button. This button can be found to the right of “Step 1: Select type of labor estimates” at the top of the query screen.
Troubleshooting query
Not all subcategories are displayed when specifying variables using the Select Reports Variable (e.g., you selected the variable of sex, but your results only list males): You probably restricted results by choosing an individual parameter such as Sex = Male then used Column or Row Variable = Sex in the current or a previous query. Check all query parameters selected (variables selected in the Select Reports Variable section do not override selected individual parameters that restrict the query). Also, subcategories with a value of zero are not displayed.
Result table doesn't print properly: Export the results into Excel, Word, or .pdf. Also, try setting your printer to print in landscape.
Labor estimate is not equal to the labor estimate you calculated previously in the query system: Your query parameters are not identical. Compare the query parameters, giving special attention to the “Labor estimate type” and the “Weight in use.”
Labor estimate is not equal to the labor estimate published by the Bureau of Labor Statistics (BLS): Here are some of reasons your estimate may not match a BLS estimate.
- BLS published estimates are rounded to the nearest thousand.
- BLS uses the composite weight variable to weight data. In ELF, queries are programmed to default to the composite weight variable when possible. However, some query parameters require use of another weight or you may have selected an alternate weight.
- BLS does not include 15 year-old workers. Adding this age group to your query guarantees your results will not match BLS results. Also, inclusion of this age group forces use of a weight different than the composite weight, the default BLS weight.
You received a "Timeout" or other error message instead of a results table: Try the query again now or at another time of day. Selecting report variable categories with lots of subcategories (e.g., industry or occupation code) may also cause the system to run very slowly.
How to use advanced query options for FTE calculations
If you chose to calculate an FTE labor force estimate, there will be checkboxes that provide “advanced” query options at the bottom of the expanded Workforce and Industry/Occupation query parameter boxes. These options are considered “advanced” as results have the potential to easily be misinterpreted, particularly if the user does not have a good understanding of CPS data. Advanced query options should be used with great caution.
Depending on the type of FTE estimate selected, advanced options provide the opportunity to perform additional calculations related to primary, secondary, and/or all jobs worked. However, the hours worked continues to reflect the hours specified in “Step 1: Select type of labor estimates.”
How to use advanced query options for data weighting
Under “Step 3: Select report variables” there is an option to change the weight variable applied to your query. The default weight variable will produce an estimate comparable to published BLS estimates, if available. In cases where selected query parameters are not published by BLS (e.g., inclusion of 15 year-olds), the system will display the most applicable weight based on the selected parameters. Refer to the Technical Info section for details on the weight assignment algorithm used.
Additional weight options are available only if they can be legitimately applied with the selected query parameters. To change the applied weight, select the desired weight variable from the drop down list.
The option to select an alternate weight is considered “advanced” as the user should have a good understanding of CPS data and the weight variables prior to changing the default weight.