


Data are routinely reported to the FoodNet active surveillance database and summaries of these data are uploaded to FoodNet Fast each year. The summary data on FoodNet Fast do not account for changes over time in areas such as diagnostics and demographics, and some data fields do not appear in FoodNet Fast to protect patient privacy. If you plan to analyze FoodNet data for presentation or publication, please contact FoodNet@cdc.gov to request an appropriate dataset.
Filter by:
Only available when single bacterial pathogen selected
Only available when Culture-confirmed is selected for Test Method
to
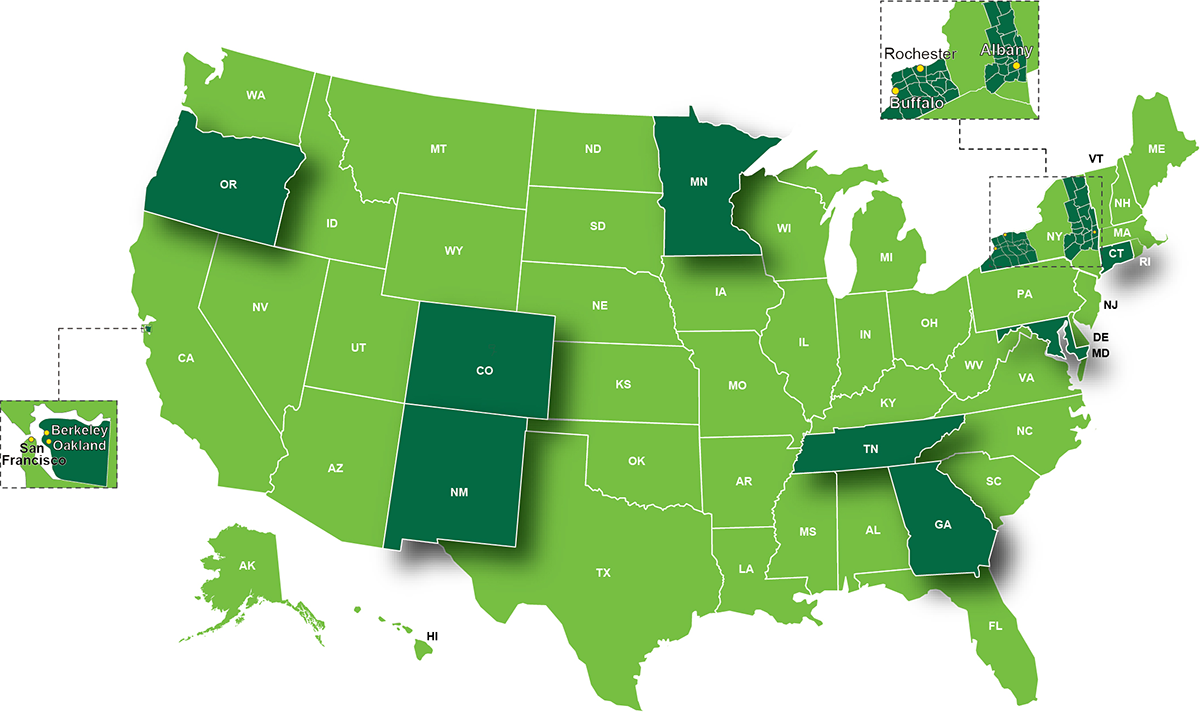
FoodNet Sites
Founded in 1995, FoodNet now has sites in 10 states, covering 15% of the U.S. population. Learn more >
Data last updated: 05/01/26
Pathogen Surveillance
Incidence per 100,000 population – FoodNet sites
† Shiga toxin-producing Escherichia coli
Monthly percentage of infections – FoodNet sites
† Shiga toxin-producing Escherichia coli
Number of infections – FoodNet sites
† Shiga toxin-producing Escherichia coli
