


Data are routinely reported to the FoodNet active surveillance database and summaries of these data are uploaded to FoodNet Fast each year. The summary data on FoodNet Fast do not account for changes over time in areas such as diagnostics and demographics, and some data fields do not appear in FoodNet Fast to protect patient privacy. If you plan to analyze FoodNet data for presentation or publication, please contact FoodNet@cdc.gov to request an appropriate dataset.
Filter by:
to
FoodNet Sites
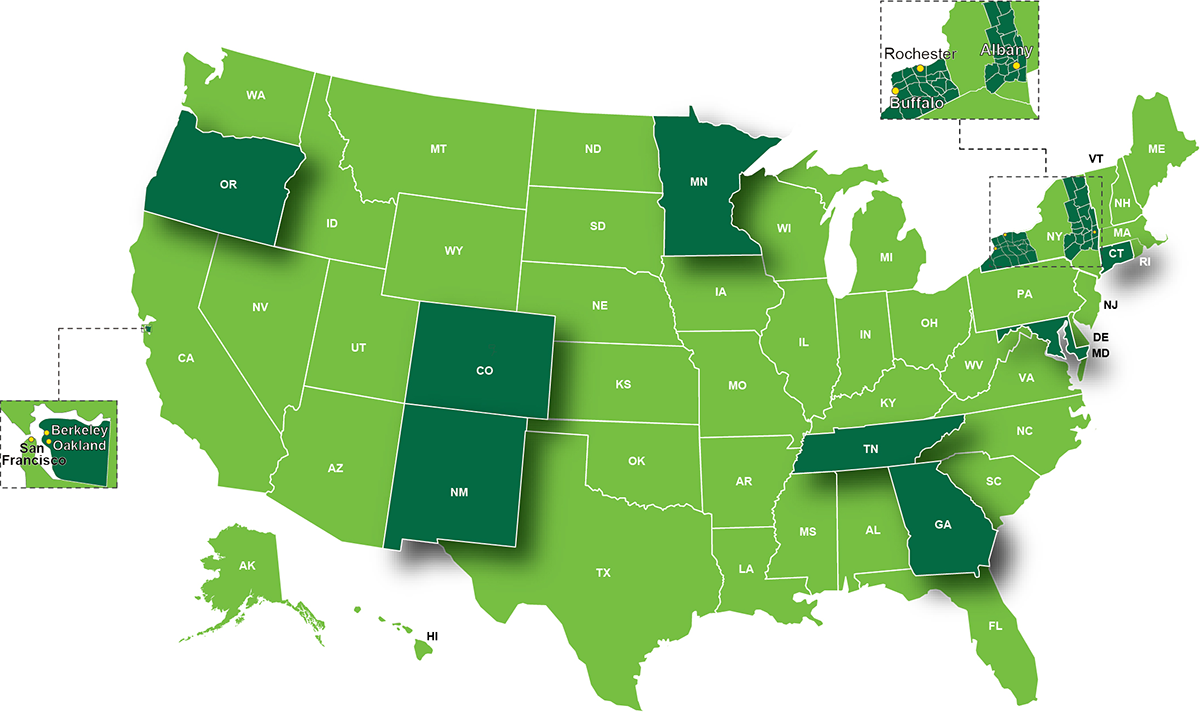
Founded in 1995, FoodNet now has sites in 10 states, covering 15% of the U.S. population. Learn more >
Data last updated: 05/05/26
Hemolytic Uremic Syndrome (HUS)
Cases
1,739
cases
cases
0.6
incidence per 100,000 children
incidence per 100,000 children
Hospitalizations
11 days
median days of hospitalization
median days of hospitalization
0 to 372
range of hospitalization days
range of hospitalization days
Deaths
42
deaths
deaths
2.4%
of HUS patients died
of HUS patients died
Incidence per 100,000 of post-diarrheal HUS in children by year for FoodNet sites
Percentage of pediatric, post-diarrheal HUS patients by month for FoodNet sites
Seasonality data are not displayed for all FoodNet sites. As a result, totals for this figure may not match totals displayed in other parts of FoodNet Fast. Users should be aware of this limitation before using these data for analysis.
Incidence per 100,000 of post-diarrheal HUS in children by age group and sex for FoodNet sites
Percentage of pediatric, post-diarrheal HUS patients in FoodNet sites having evidence of STEC, by year
Percentage of pediatric, post-diarrheal HUS patients, by laboratory testing method used
Number of HUS patients among those with culture-confirmed STEC infection, by serogroup
* Evidence of STEC includes cases that are culture-confirmed, serology-positive, or Shiga toxin-positive only.
† O157 and non-O157 includes cases that are confirmed to have O157 and one or more non-O157 serogroups.
‡ Multiple non-O157 includes any combination of non-O157 serogroups.
† O157 and non-O157 includes cases that are confirmed to have O157 and one or more non-O157 serogroups.
‡ Multiple non-O157 includes any combination of non-O157 serogroups.
Evidence of STEC includes all HUS cases that have tested positive for STEC by one or more methods of testing. Shiga toxin-positive only includes testing by Immunoassay and/or PCR for Shiga toxin or the genes that produce it. The pie graph breaks down evidence of STEC by testing method and no evidence. These designations are mutually exclusive; therefore,
- Culture-confirmed: shows the percentage of patients who tested positive for STEC infection by culture. Culture-positive STEC infections are Shiga toxin-positive. Patients may also be positive for STEC O157 by serology.
- Serology-positive: shows the percentage of patients who tested positive for STEC O157 by serology. These patients do not have a culture-confirmed STEC infection but they may have tested positive for Shiga toxin by other methods.
- Shiga toxin-positive only: shows the percentage of patients who tested positive for Shiga toxin.
- No evidence of STEC: shows the percentage of HUS patients who did not test positive for STEC infections. This includes patients who were not tested for STEC infection or who tested negative for STEC infection.
Incidence per 100,000 children of HUS and confirmed STEC O157 and non-O157 infections by year for FoodNet sites
FoodNet pathogen surveillance data
Confirmed infections of STEC O157 and non-O157 in children (right axis) from FoodNet pathogen surveillance and postdiarrheal HUS (left axis) in children from HUS surveillance
Incidence per 100,000 children of post-diarrheal HUS from HUS surveillance (left axis) and in confirmed infections of STEC O157 and non-O157 (right axis) from pathogen surveillance in FoodNet sites
