National Health and Nutrition Examination Survey

Weighting

This module addresses why weights are created and how they are calculated, the importance of weights in making estimates that are representative of the U.S. civilian non-institutionalized population, how to select the appropriate weight to use in your analysis, and when and how to construct weights when combining survey cycles.

Weights are created in NHANES to account for the complex survey design (including oversampling), survey non-response, and post-stratification adjustment to match total population counts from the Census Bureau. When a sample is weighted in NHANES it is representative of the U.S. civilian noninstitutionalized resident population. A sample weight is assigned to each sample person. It is a measure of the number of people in the population represented by that sample person.

How weights are created in the Continuous NHANES

The sample weight is created in three steps:

  1. the base weight is computed, which accounts for the unequal probabilities of selection given that some demographic groups were over-sampled;
  2. adjustments are made for non-response; and
  3. post-stratification adjustments are made to match estimates of the U.S. civilian non-institutionalized population available from the Census Bureau.

1. Calculation of the base weight

In general a sample person is assigned a weight that is equivalent to the reciprocal of his/her probability of selection. In other words:

$$\text{Sample person's weight} = \frac{1}{\text{probability of selection}}$$

However, calculating the base weight for a sample person in NHANES is much more complicated due to the survey's complex, multistage design. In NHANES, the following equation, which takes into account the survey design, is used to determine the base weight for a sample person:

$$\text{Base weight} = \frac{1}{\text{final probability}}$$

where

$$\begin{align*} \text{Final probability} =&\big(\Pr(\text{PSU is selected}) \\ &\times \Pr(\text{segment of the PSU is selected}) \\ &\times \Pr(\text{household is selected}) \\ &\times \Pr(\text{individual is selected})\big) \end{align*}$$

IMPORTANT NOTE

The NHANES sample weights can be quite variable due to the oversampling of subgroups. For estimates by age and race and Hispanic origin, use of the following age categories is recommended for reducing the variability in the sample weights and therefore reducing the variance of the estimates: 5 years and under, 6-11 years, 12-19 years, 20-39 years, 40-59 years, 60 years and over.

2. Adjustment for nonresponse

Adjustment for nonresponse to the interview or exam

The base weights were adjusted for nonresponse to the in-home interview when creating interview weights and further adjusted for non-response to the MEC exam when creating exam weights.

In NHANES, an individual can be classified as a non-respondent to the interview portion of the survey and/or the exam portion. An individual is considered a non-respondent to the interview if he/she was selected to be in the sample, but did not participate in the in-home interview. Similarly, an individual who completed the interview but did not agree to, or come in for, the MEC portion of the survey is considered a non-respondent to the exam. Adjustments made for survey non-response account only for sample person interview or exam non-response, but not for item non-response (i.e., a sample person declined to have their blood pressure measured in the examination component but completed all other examination components).

Response rates by age and gender for all cycles of Continuous NHANES can be downloaded from the NHANES response rates website.

Adjustment for nonresponse to NHANES subsample components

NHANES respondents are asked to participate in a variety of survey components that are statistically defined (or random) subsamples of the NHANES MEC-examined sample. These include a variety of lab, nutrition/dietary, environmental, or mental health components. (Please see the respective survey protocol/documentation for more specific information.) For example, participants who were selected to schedule their MEC exam in a morning session (half of all examined participants) were asked to give a fasting blood sample. The subsamples selected for these components are chosen at random with a specified sampling fraction (for example, 1/2 or 1/3 of the total examined group) according to the protocol for that component. Each component subsample has its own designated weight, which accounts for the additional probability of selection into the subsample component, as well as an additional adjustment for component nonresponse.

Diagram of Sample Non-response

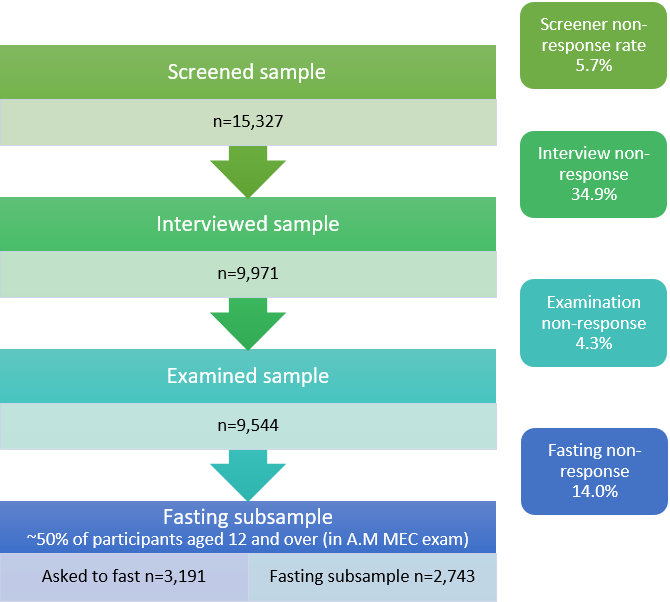
Diagram of Nonresponse Rates for NHANES 2015-2016
* Unweighted response rates = [(Unweighted sample size) / (Screener sample size)] × (the screener response rate: 94.3%)

The diagram above demonstrates the varying levels of sampling nonresponse. In the example above, the selected sample included a total of 15,327 sample persons for the years 2015–2016. Only 9,971 of those sample persons actually completed the in-home interview. Therefore 34.9% of the individuals sampled did not complete the in-home interview. This is interview nonresponse. In 2015–2016, because the screener response rate was lower than 98%, the unweighted response rate for the interviewed sample was adjusted to incorporate non-response at the screener level. The unweighted response rate for the interviewed sample was 61.3%.

Among the 9,971 sample persons who were interviewed, only 9,544 completed the MEC exam. Therefore an additional 4.3% of the interviewed sample persons did not respond to the MEC exam. This is the MEC exam nonresponse. The unweighted response rate for the examined sample, adjusted for non-response at the screener level, was 58.7%.

This example also shows the additional subsampling for the AM fasting blood sample. Approximately 50% of MEC participants aged 12 and over (3,191 persons) were partitioned to fast for 9 hours and come to the morning MEC exam. Of the 3,191 persons partitioned to the morning subsample, only 2,743 actually fasted, so the morning fasting sample was adjusted for the additional 14.0% nonresponse to the morning fast.

3. Post-stratification adjustment to match population control totals from the U.S. Census Bureau

In addition to accounting for sample person non-response, weights are also post-stratified to match the population control totals for each sampling subdomain. This additional adjustment makes the weighted counts the same as an independent estimate of the noninstitutionalized civilian population of the United States.

For NHANES 2011-2016, the sample weights were post-stratified to population totals obtained from the American Community Survey (ACS). The weights for earlier NHANES cycles were post-stratified to population totals from the Current Population Survey (CPS). This change from the CPS to the ACS was made, in part, because the larger sample size of the ACS could provide more reliable population estimates for Asian persons within age and sex categories, which was required due to the addition of the Asian oversample in the 2011 survey.

The population controls totals (by gender, age, and race and Hispanic origin domains) used for each NHANES cycle are available on the NHANES Response Rates and Population Totals page.

Summary

The sample weights are created to account for the complex survey design (including oversampling), survey nonresponse, and post-stratification in order to ensure that calculated estimates are representative of the U.S. civilian noninstitutionalized population. More information about how the NHANES weights are created can be found in the Estimation Procedures documents on the NHANES website.

Adjusting for oversampling

As described in the Sample Design module, NHANES is designed to sample larger numbers of certain subgroups of particular public health interest in order to increase the reliability and precision of estimates of health status indicators for these population subgroups. The sample weights allow estimates from these subgroups to be combined to obtain national estimates that reflect the true relative proportions of these groups in the U.S. population as a whole.

The graph below compares the unweighted interview sample from NHANES 2015-2016, the weighted interview sample, and the US civilian non-institutionalized population totals from the American Community Survey (ACS).

Bar chart of race-ethnicity distributions in unweighted interview sample, weighted interview sample, and U.S. population

Graph Comparing NHANES Unweighted Interview Sample, Weighted Interview Sample, and U.S. Population

NOTES: *Non-Hispanic white and other includes non-Hispanic persons who reported races other than black, Asian, or white and non-Hispanic persons who reported multiple races.
Race and Hispanic origin groups are categorized based on recoded variable ridreth3.
Estimates do not sum to exactly 100% due to rounding.

The non-Hispanic black, non-Hispanic Asian, and Hispanic groups are all oversampled in NHANES 2015-2016, so each group comprises a larger share of the unweighted interview sample than its share of the weighted interview sample. For example, non-Hispanic black persons comprise 21.4% of the unweighted sample but only 11.9% of the weighted sample. Therefore, unweighted estimates for any survey item associated with race and Hispanic origin would be biased if weights were not used, and these estimates would not be representative of the actual U.S. civilian noninstitutionalized population.

The weighted percentages for each race and Hispanic origin group are very close to the distribution of the US civilian noninstitutionalized population from the ACS. This is due to the post-stratification adjustment (described in step 3, above) to make the total weights for each sampling subdomain match the population totals from the ACS. The percentages do not match exactly because the publicly released recoded race and Hispanic origin variables (ridreth1 and ridreth3) categorize non-Hispanic persons who report multiple races differently than the sampling race and Hispanic origin categories used in the post-stratification adjustment. See Section 2.1.1 of the "Analytic Guidelines, 2011-2014 and 2015-2016" for more information.

Why weight?

The following example illustrates the importance of using the sample weights in analyses by comparing unweighted and properly weighted estimates of the prevalence of hypertension in US adults aged 18 and over from NHANES 2015-2016. This example is based on the data analyzed in NCHS Data Brief No. 289, "Hypertension Prevalence and Control Among Adults: United States, 2015–2016."

For this analysis, hypertension is defined as systolic blood pressure greater than or equal to 140 mmHg or diastolic blood pressure greater than or equal to 90 mmHg, or currently taking medication to lower high blood pressure. (Note: After this data brief was published, the American College of Cardiology/American Heart Association released updated 2017 clinical practice guidelines that define hypertension as a blood pressure reading of 130/80 mmHg or higher, instead of 140/90 mmHg or higher.)

Comparison of weighted and unweighted estimates for the prevalence of hypertension among adults aged 18 and over: United States, 2015-2016

Subpopulation of interest Weighted (crude) estimate* (%) Unweighted estimate (%)
Adults aged 18 and over 32.1 35.9
Hispanic adults aged 18 and over 23.1 33.4

* Weighted with MEC exam weight (wtmec2yr)

As shown in the table above, the unweighted estimates can differ greatly from the properly-weighted estimates. Among adults aged 18 and over, the properly-weighted estimated prevalence of hypertension was 32.1%, while the unweighted estimate was 35.9%, or 3.8 percentage points higher. (The weighted crude estimate is shown in the notes for Figure 1 of the data brief; the graph for Figure 1 shows the age-adjusted estimate.)

Why is the unweighted estimate higher than the weighted estimate? Part of the difference is that the unweighted estimate over-represents non-Hispanic black adults – a group with a higher prevalence of hypertension – because non-Hispanic black persons were over-sampled for NHANES 2015-2016. As shown in the graph above, non-Hispanic black persons comprise 21.4% of the unweighted sample but only 11.9% of the weighted sample. We also know from Figure 2 of the data brief that the (age-adjusted) prevalence of hypertension was higher among non-Hispanic black adults than non-Hispanic white, non-Hispanic Asian, or Hispanic adults.

Among Hispanic adults aged 18 and over, the properly-weighted estimated prevalence of hypertension was 23.1%, while the unweighted estimate was 33.4%, or 10.3 percentage points higher. Why is the unweighted estimate higher than the weighted estimate? Part of the explanation is that hypertension prevalence increases with age (as seen in Figure 1 of the data brief), and the unweighted estimate over-represents Hispanic adults aged 60 and over, compared with their actual share of the Hispanic adult population.

These examples illustrate the importance of using the sample weights in analyses to account for the complex survey design (including oversampling), survey nonresponse, and post-stratification. The sample weights must be used in order to calculate estimates that are representative of the U.S. civilian noninstitutionalized population or any subpopulation of interest. You can download the code used to produce these examples on the Sample Code module.

Various sample weights are available on the data release files – such as the interview weight (wtint2yr), the MEC exam weight (wtmec2yr), and several subsample weights. Use of the correct sample weight for NHANES analyses depends on the variables being used. A good rule of thumb is to use "the least common denominator" where the variable of interest that was collected on the smallest number of respondents is the "least common denominator." The sample weight that applies to that variable is the appropriate one to use for that particular analysis.

Review the documentation file for each component included in your analysis; the analytic notes often recommend the appropriate weight to be used for analyzing variables from that component. Be aware that some questionnaire components were administered during the MEC session rather than during the in-home interview, and therefore the MEC exam weights must be used for these components.

All interview and MEC exam weights can be found on the demographic file for the respective survey cycle. Weights for a given component conducted on only a subsample of the original NHANES sample (e.g. many environment chemicals) are available on the data file for that particular component.

You must use the weight of the smallest subpopulation that includes all the variables you want to include in your analysis. To select the correct weight for your analysis, you need to find out in which component of the survey your variables of interest were included.

Examples

Example 1: All of the variables were collected in the in-home interview

You are performing an NHANES 2013-2016 analysis to look at the association of race and Hispanic origin, and poverty on previous diagnosis of diabetes among adults aged 20 and over. All of these variables were collected in the in-home interview (N=11,488 adults aged 20 and over).

Answer: You would use the interview weights for your analysis (wtint4yr). Because this analysis combines multiple survey cycles, you would need to use or create the appropriate multi-year interview weight as described in following section, "Constructing Weights for Combined NHANES Survey Cycles."

Example 2: Some of the variables were collected in the MEC

You are performing an NHANES 2013-2016 analysis looking at the association of race and Hispanic origin, age, poverty and the prevalence of high blood pressure among adults aged 20 and over. All three demographic variables were collected during the in-home interview (N=11,488). But blood pressure was collected during the MEC exam and MEC questionnaire portion of the survey (N=11,062). MEC-examined sample persons are a subset of those interviewed in the survey.

Answer: You would use the MEC exam weight for your analysis (wtmec4yr). Because this analysis combines multiple survey cycles, you would need to use or create the appropriate multi-year interview weight as described in following section, "Constructing Weights for Combined NHANES Survey Cycles."

Example 3: Some of the variables were part of a component subsample of the survey

You are performing an NHANES 2013-2016 analysis looking at the association of race and Hispanic origin, age, blood pressure and fasting triglycerides among adults age 20 and over. Race and Hispanic origin and age were available from the in-home interview (N=11,488) Blood pressure came from the MEC exam. MEC-examined sample persons are a subset of those interviewed in the survey. Fasting triglycerides are collected from those sample persons who were subsampled to fast before attending a morning MEC exam session and who actually fasted for at least 8.5 hours before the blood draw.. This group is approximately half the sample of those who were MEC examined (N=4,660).

Answer: You would use the fasting subsample weights (wtsaf4yr). Because this analysis combines multiple survey cycles, you would need to use or create the appropriate multi-year interview weight as described in following section, "Constructing Weights for Combined NHANES Survey Cycles."

Example 4: Some of the variables were from the 24-hour dietary recall

Although the 24-hour dietary recall is not considered a subsample, participants who completed this component also have special weights that adjust for non-response to the dietary component and incorporate the day of the week of recall. This adjustment is needed because food intake often varies between weekdays and weekends.

Answer: You would use the dietary day one sample weight (wtdrd1) for an analysis that uses data from the first dietary recall. In addition, the dietary two-day sample weight (wtdr2d) was constructed for participants who completed two days of dietary recall, and this weight should be used if an analysis uses both days of dietary intake. See the documentation for the dietary component for more information about the sample weights for the dietary intake data.

If your analysis combines multiple survey cycles, you would need to use or create the appropriate multi-year dietary day one sample weight as described in following section, "Constructing Weights for Combined NHANES Survey Cycles."

WARNING

It is important to check all the variables in your analysis and use the weight that is appropriate for the variable of interest that was collected on the smallest number of respondents, otherwise you will not obtain estimates appropriately adjusted for survey non-response.

All interview and MEC exam weights can be found on the demographic file for the respective survey cycle. Weights for a given component conducted on only a subsample of the original NHANES sample are available on the data file for that particular component. Although the 24-hour dietary recall is not considered a subsample, special weights are also provided on the dietary data files to incorporate the day of the week of recall.

The sample design for NHANES makes it possible to combine two or more survey cycles to increase the sample size and analytic options. Each two-year cycle and any combination of two-year cycles is a nationally representative sample. However, sometimes the size of a particular sample is too small in an individual two-year cycle to produce statistically reliable estimates. Fortunately, the NHANES sample design makes it possible to combine two or more cycles to increase the sample size and analytic options. This enables the analyst to produce estimates with greater statistical reliability for demographic subdomains (e.g. sex – age – race and Hispanic origin groups) or rare events.

In general, any two-year data cycle in NHANES can be combined with adjacent two-year data cycles to create analytic data files based on four or more years of data to produce estimates with greater precision and smaller sampling error. However, when combining cycles of data, it is extremely important to:

  1. be aware of sample design changes that may affect combining data,
  2. verify that data items collected in all combined years are comparable in wording, methods, and inclusion/exclusions (e.g. eligible age range),
  3. select the proper weight to use for the combined dataset, and
  4. examine the inherent assumption of no trend in the estimate over the time period being combined.

For more information about determining the compatibility of datasets, please see the Datasets and Documentation module.

IMPORTANT NOTE

Beginning in 2003, the survey content for each two-year period is held as constant as possible to be consistent with the data release cycle. In the first 4 years of the continuous survey (1999-2002), this was not always the case.

When you combine two or more two-year cycles of the continuous NHANES, you must use or construct the appropriate weights so that the estimates will be representative of the civilian non-institutionalized population at the midpoint of the combined survey period.

Sample weights for combining NHANES 1999-2000 and 2001-2002 cycles

Sample weights for NHANES 1999-2000 were based on population estimates developed by the Census Bureau before the Year 2000 Decennial Census counts became available. The two-year sample weights for NHANES 2001-2002, and all other subsequent two-year cycles, are based on population estimates that incorporate the year 2000 Census counts. Because different population bases were used, the two-year weights for 1999-2000 and 2001-2002 are not directly comparable. Therefore, when combining 1999-2000 with 2001-2002 survey years in analyses, you must use the 4-year sample weights provided by NCHS since these have been created to account for the two different reference populations.

For both 1999-2000 and 2001-2002 survey cycles, the following sample weight variables are provided:

  • wtint2yr and wtint4yr for all interviewed sample persons, in the demographic file;
  • wtmec2yr and wtmec4yr for the sample persons who have MEC data items, in the demographic file; and
  • two-year and four-year subsample weights for selected sample persons, on subsample datasets with consistent data elements across these two survey cycles

When analyzing data for the four years 1999-2002, you must use one of these 4-year sample weights provided on the data files. (See the section "Selecting the Correct Weight in NHANES" for more information about whether to use the interview weight, the MEC exam weight, or one of the subsample weights for your analysis.) When combining data from 1999-2002 with additional survey years (i.e. to produce 6-year or 8-year estimates), you must construct a combined sample weight using the 4-year weight for 1999-2002 and the 2-year weights from each additional survey cycle. Formulas are provided below.

WARNING

For all analyses that combine 1999–2000 and 2001–2002 survey cycles, you must start by using the 4 year weights provided by NCHS.

Sample weights for combining NHANES 2001-2002 and beyond

The two-year sample weights for NHANES 2001-2002 and all subsequent two-year cycles are based on population estimates that incorporate the year 2000 Census counts. NCHS does not construct or include all possible weights for the combinations of multiple two-year cycles in the public release files because it would be impractical to do so. Instead, NCHS supplies analysts with information on how to combine these cycles and construct the appropriate weights. When combining two or more two-year cycles from 2001–2002 onward, new multi-year sample weights can be computed by simply dividing the two-year sample weights by the number of two-year cycles in the analysis. Formulas are provided in the table below.

Formulas for Constructing Weights When Combining NHANES Cycles
Combined survey years SAS Code with Formulas for Combining Weights across Survey Cycles*
Combining two survey cycles (four years)
1999-2002 N/A -- Four-year weight is provided on the data file
2001-2004 if sddsrvyr in (2,3) then MEC4YR = 1/2 * WTMEC2YR;
2003-2006 if sddsrvyr in (3,4) then MEC4YR = 1/2 * WTMEC2YR;
2005-2008 if sddsrvyr in (4,5) then MEC4YR = 1/2 * WTMEC2YR;
2007-2010 if sddsrvyr in (5,6) then MEC4YR = 1/2 * WTMEC2YR;
2009-2012 if sddsrvyr in (6,7) then MEC4YR = 1/2 * WTMEC2YR;
2011-2014 if sddsrvyr in (7,8) then MEC4YR = 1/2 * WTMEC2YR;
2013-2016 if sddsrvyr in (8,9) then MEC4YR = 1/2 * WTMEC2YR;
2015-2018 if sddsrvyr in (9,10) then MEC4YR = 1/2 * WTMEC2YR;
Combining three survey cycles (six years)
1999-2004
if sddsrvyr in (1,2) then MEC6YR = 2/3 * WTMEC4YR; /* for 1999-2002 */
else if sddsrvyr = 3 then MEC6YR = 1/3 * WTMEC2YR; /* for 2003-2004 */
2001-2006 if sddsrvyr in (2,3,4) then MEC6YR = 1/3 * WTMEC2YR;
2003-2008 if sddsrvyr in (3,4,5) then MEC6YR = 1/3 * WTMEC2YR;
2005-2010 if sddsrvyr in (4,5,6) then MEC6YR = 1/3 * WTMEC2YR;
2007-2012 if sddsrvyr in (5,6,7) then MEC6YR = 1/3 * WTMEC2YR;
2009-2014 if sddsrvyr in (6,7,8) then MEC6YR = 1/3 * WTMEC2YR;
2011-2016 if sddsrvyr in (7,8,9) then MEC6YR = 1/3 * WTMEC2YR;
2013-2018 if sddsrvyr in (8,9,10) then MEC6YR = 1/3 * WTMEC2YR;
Combining four survey cycles (eight years)
1999-2006
if sddsrvyr in (1,2) then MEC8YR = 2/4 * WTMEC4YR; /* for 1999-2002 */
else if sddsrvyr in (3,4) then MEC8YR = 1/4 * WTMEC2YR; /* for 2003-2006 */
2001-2008 if sddsrvyr in (2,3,4,5) then MEC8YR = 1/4 * WTMEC2YR;
2003-2010 if sddsrvyr in (3,4,5,6) then MEC8YR = 1/4 * WTMEC2YR;
2005-2012 if sddsrvyr in (4,5,6,7) then MEC8YR = 1/4 * WTMEC2YR;
2007-2014 if sddsrvyr in (5,6,7,8) then MEC8YR = 1/4 * WTMEC2YR;
2009-2016 if sddsrvyr in (6,7,8,9) then MEC8YR = 1/4 * WTMEC2YR;
2011-2018 if sddsrvyr in (7,8,9,10) then MEC8YR = 1/4 * WTMEC2YR;
Combining five survey cycles (ten years)
1999-2008
if sddsrvyr in (1,2) then MEC10YR = 2/5 * WTMEC4YR; /* for 1999-2002 */
else if sddsrvyr in (3,4,5) then MEC10YR = 1/5 * WTMEC2YR; /* for 2003-2008 */
2001-2010 if sddsrvyr in (2,3,4,5,6) then MEC10YR = 1/5 * WTMEC2YR;
2003-2012 if sddsrvyr in (3,4,5,6,7) then MEC10YR = 1/5 * WTMEC2YR;
2005-2014 if sddsrvyr in (4,5,6,7,8) then MEC10YR = 1/5 * WTMEC2YR;
2007-2016 if sddsrvyr in (5,6,7,8,9) then MEC10YR = 1/5 * WTMEC2YR;
2009-2018 if sddsrvyr in (6,7,8,9,10) then MEC10YR = 1/5 * WTMEC2YR;

*SDDSRVYR is the survey cycle variable, i.e.
1 = 1999-2000
2 = 2001-2002
3 = 2003-2004
4 = 2005-2006
5 = 2007-2008
6 = 2009-2010
7 = 2011-2012
8 = 2013-2014
9 = 2015-2016
10= 2017-2018
Etc.

NOTE: Formulas are shown for combining the MEC examination weights (wtmec2yr). The same structure would apply for combining the interview weights (wtint2yr) or any of the subsample weights (e.g. the fasting subsample weight, wtsaf2yr).

Examples of Constructing Weights when Combining Survey Cycles of Continuous NHANES

Example 1: How to combine four years of data from 1999-2000 and 2001-2002

Answer: You must use the 4 year weights provided (WTMEC4YR) in the SAS demographic file (see explanation above).

Example 2: How to combine four years of data from 2001-2002 and 2003-2004

Answer: When combining survey cycles for 2001-2002 onward, create a four-year weight variable by dividing the 2-year weights (WTMEC2YR) by the number of two-year cycles in the analysis (2).
if sddsrvyr in (2,3) then MEC4YR = 1/2 * WTMEC2YR;

Example 3: How to combine six years of data from 1999-2004

Answer: Because you are using the 1999-2000 survey combined with 2001-2002, you must begin with the 4-year weights provided for 1999-2001 (WTMEC4YR) in conjunction with the 2-year weights for 2003-2004 (WTMEC2YR) found in the demographic files. This will allow you to create a 6-year weight variable (MEC6YR) using the following code.

For 6 years of data from 1999-2004 a weight should be constructed as:

if sddsrvyr in (1,2) then MEC6YR = 2/3 * WTMEC4YR; /* for 1999-2002 */
else if sddsrvyr = 3 then MEC6YR = 1/3 * WTMEC2YR; /* for 2003-2004 */ 

Example 4: How to combine six years of data from 2001-2006 (or any future cycles)

Answer: Because you are not combining any data from 1999-2000, you can create create a six-year weight variable by dividing the 2-year weights (WTMEC2YR) by the number of two-year cycles in the analysis (3).
if sddsrvyr in (2,3,4) then MEC4YR = 1/3 * WTMEC2YR;

NOTE

For any combination of survey cycles from 2001-2002 and beyond that does not include 1999-2000 data, the multiyear sample weight constructed using the formulas in the above table is a linear scaling of the two-year weight, i.e. the weight is multiplied by a constant equal to (1 / number of survey cycles.) Weighted estimates of most population parameters (e.g. proportions, means, percentiles) and their standard errors produced using this scaled multiyear weight should match the weighted estimates that would be produced by using the two-year weight variable directly.

WARNING

However, for all analyses that combine 1999-2000 with other survey cycles, you must start by using the 4-year weights provided by NCHS for 1999-2002, then include the 2-year weights for each additional 2-year cycle that is combined.

Using the two-year weights for the 1999-2000 and 2001-2002 cycles would produce incorrect estimates of population parameters (e.g. proportions, means, percentiles) and their standard errors.

For all survey cycles, weighted estimates of population totals and their standard errors will be affected by the weight scaling. However, analysts are advised NOT to use the sum of weights to determine population estimates for a given health condition because the potential for exclusions or missing data for that health condition may lead to population underestimates. See the Sample Code module for more information on the recommended procedure for population estimates.

Reference

Heeringa S, West BT, Berglund PA. Applied survey data analysis. Second edition. ed. Boca Raton, FL: CRC Press, Taylor & Francis Group; 2017.